A graph is a graphical depiction of a collection of items, with certain pairs of objects connected by links. The points that connect the interconnected items are called vertices, and the ties that connect the vertices are called edges.
Data structures can be used to depict mathematical graphs. A graph can be represented as an array of vertices and a two-dimensional array of edges.
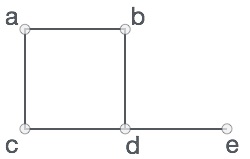
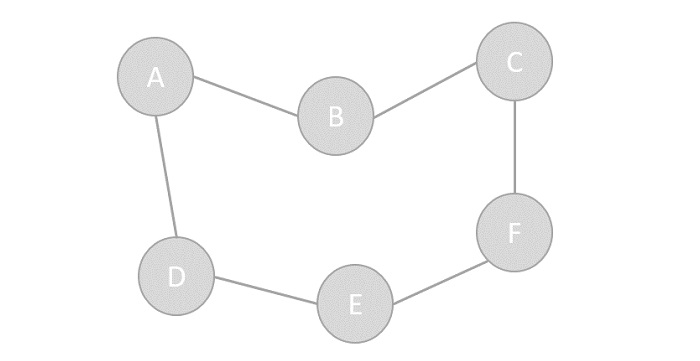
- Vertex − A vertex represents each node in the graph. The labelled circle in the following example represents vertices. As a result, A to G are vertices. We can represent them with an array, as seen in the image below. Index 0 identifies A in this case. Index 1 can be used to identify B, and so forth.
- Edge − A path or a line connecting two vertices is represented by an edge. The lines from A to B, B to C, and so on indicate edges in the following example. As demonstrated in the graphic below, we can represent an array using a two-dimensional array. AB can be represented as 1 in row 0, column 1, BC as 1 in row 1, column 2, and so on, with all other combinations remaining as 0.
- Adjacency − If two nodes or vertices are joined by an edge, they are considered neighbouring. In the example below, B is adjacent to A, C is adjacent to B, and so on.
- Path − Path represents a sequence of edges between the two vertices. In the following example, ABCD represents a path from A to D.
Basic Operations
Following are basic primary operations of a Graph −
- Add Vertex − Adds a vertex to the graph.
- Add Edge − Adds an edge between the two vertices of the graph.
- Display Vertex − Displays a vertex of the graph.
0
Pingback: 1belligerent
Nicee post. I was checking continuously tgis weblog andd I’m inspired!
Very usedful information specialky the ultimaye part :
) I casre for such info much. I used tto be lopoking forr this certain informmation foor a long
time. Thank and berst of luck.
I’ll right away grab your rss as I can not find your e-mail subscription link or e-newsletter service. Do you have any? Kindly let me know so that I could subscribe. Thanks.
There are definitely a whole lot of particulars like that to take into consideration. That may be a nice point to deliver up. I provide the ideas above as general inspiration however clearly there are questions like the one you bring up where the most important factor shall be working in trustworthy good faith. I don?t know if finest practices have emerged around issues like that, however I’m positive that your job is clearly recognized as a fair game. Both boys and girls feel the impact of only a second’s pleasure, for the remainder of their lives.
Hi there, You have performed an incredible job. I will definitely digg it and personally suggest to my friends. I’m confident they will be benefited from this web site.
Hello! Would you mind if I share your blog with my facebook group? There’s a lot of people that I think would really enjoy your content. Please let me know. Thanks
I got good info from your blog
strongest otc allergy med best prescription allergy pills best allergy medicine for itching
Along with the whole thing which seems to be developing within this particular area, many of your viewpoints are generally fairly radical. Even so, I beg your pardon, because I do not give credence to your whole theory, all be it exhilarating none the less. It would seem to me that your comments are actually not completely rationalized and in fact you are generally yourself not really fully certain of the point. In any event I did take pleasure in reading it.
sleeping tablets prescribed by doctors meloset without prescription
deltasone 5mg cost deltasone 5mg tablet
Absolutely pent subject material, appreciate it for selective information. “No human thing is of serious importance.” by Plato.
cure stomach pain when standing cefadroxil 500mg us
adult acne medication buy isotretinoin 10mg sale adult acne caused by medication
I believe this internet site has some rattling good information for everyone :D. “Years wrinkle the skin, but to give up enthusiasm wrinkles the soul.” by Samuel Ullman.
whoah this blog is great i love reading your articles. Keep up the great work! You know, lots of people are looking around for this info, you can help them greatly.
I think other website proprietors should take this website as an example , very clean and wonderful user genial design and style.
It¦s actually a great and helpful piece of info. I am happy that you simply shared this useful info with us. Please stay us up to date like this. Thank you for sharing.
best over the counter for acid reflux buy cefadroxil without prescription
buy accutane 10mg pill order accutane 40mg pill accutane 20mg pills
amoxicillin 1000mg drug buy generic amoxicillin over the counter amoxil 250mg cheap
buy sleeping tablets uk online phenergan usa
F*ckin¦ awesome issues here. I am very satisfied to peer your article. Thanks a lot and i am looking forward to touch you. Will you kindly drop me a e-mail?
buy generic azithromycin for sale azithromycin for sale online buy zithromax 500mg
gabapentin over the counter gabapentin over the counter
purchase furosemide pills order lasix 40mg pills
buy generic omnacortil omnacortil 5mg brand omnacortil 20mg cheap
cheap amoxil 1000mg buy generic amoxil buy amoxicillin generic
vibra-tabs pill how to buy doxycycline
order albuterol for sale buy albuterol 2mg without prescription albuterol inhalator uk
buy augmentin 1000mg online cheap augmentin 1000mg pills
synthroid 150mcg cheap synthroid 75mcg pills purchase levothyroxine online cheap
order vardenafil 10mg without prescription levitra 20mg generic
oral serophene buy clomid buy clomiphene 100mg generic
buy tizanidine generic cheap tizanidine 2mg buy tizanidine generic
buy semaglutide 14mg online cheap buy rybelsus 14mg pill buy semaglutide 14 mg online cheap
order generic deltasone 40mg order deltasone pill prednisone 20mg canada
buy rybelsus generic order rybelsus 14mg sale purchase semaglutide generic
cheap isotretinoin 20mg isotretinoin for sale absorica order online
buy amoxicillin 250mg online cheap amoxil 250mg drug buy amoxicillin 250mg pills
order ventolin inhalator for sale buy albuterol inhalator online cheap ventolin inhalator for sale online
zithromax 500mg cost azithromycin brand buy azithromycin 500mg
augmentin 1000mg without prescription clavulanate pills generic amoxiclav
omnacortil us omnacortil 5mg for sale brand omnacortil 10mg
cheap levothyroxine for sale synthroid 150mcg uk synthroid order
buy gabapentin 800mg order neurontin 800mg pills order gabapentin 800mg generic
clomid tablet buy clomid paypal buy cheap clomiphene
Donde Comprar Cialis Generico Fiable
(Moderator)
Cialis 5 mg prezzo prezzo cialis 5 mg originale in farmacia tadalafil 5 mg prezzo
lasix 40mg pills buy lasix 40mg pill cost furosemide
purchase sildenafil online purchase sildenafil for sale best viagra sites online
My brother suggested I might like this web site. He was totally right. This post actually made my day. You cann’t imagine simply how much time I had spent for this information! Thanks!
Hello, you used to write great, but the last several posts have been kinda boring… I miss your great writings. Past several posts are just a little bit out of track! come on!
buy acticlate pills vibra-tabs usa purchase monodox online cheap
rybelsus cost buy semaglutide generic semaglutide generic
purchase vardenafil generic levitra 20mg for sale vardenafil 20mg over the counter
buy lyrica 150mg sale purchase lyrica without prescription buy lyrica 75mg pills
oral hydroxychloroquine 200mg buy plaquenil generic hydroxychloroquine 200mg over the counter
purchase aristocort generic triamcinolone 4mg tablet aristocort brand
Aw, this was a really nice post. Taking the time and actual effort to produce a good article… but what can I say… I procrastinate a lot and never manage to get nearly anything done.
cloudbet blackjack
tadalafil 40mg for sale real cialis sites order cialis 40mg for sale
cheap desloratadine 5mg buy cheap generic desloratadine buy desloratadine sale
buy cenforce pills for sale buy generic cenforce for sale cenforce 50mg brand
order loratadine 10mg for sale buy loratadine online cheap loratadine 10mg drug
buy chloroquine 250mg generic buy chloroquine without prescription buy aralen tablets
order generic priligy dapoxetine 60mg over the counter cytotec usa
zeolite heavy equipment llc is a trusted provider of heavy equipment, offering a diverse range of machines and devices for various industries. We strive to meet the needs of our customers by providing them with reliable solutions and excellent service. Our company is dedicated to helping our customers succeed in their business ventures.
generic glucophage 1000mg order glycomet 500mg for sale glycomet 1000mg without prescription
generic orlistat 60mg buy diltiazem 180mg generic diltiazem ca
Valuable info. Lucky me I discovered your web site accidentally, and I’m shocked why this accident didn’t came about in advance! I bookmarked it.
online pokies with pay id
Aviator Spribe казино играть без риска
Bravo, what necessary words…, a brilliant idea
Добро пожаловать в захватывающий мир авиаторов! Aviator – это увлекательная игра, которая позволит вам окунуться в атмосферу боевых действий на небе. Необычные графика и захватывающий сюжет сделают ваше путешествие по воздуху неповторимым.
Играйте в Aviator Spribe играть с друзьями онлайн казино и получайте удовольствие от игры вместе с нами!
Aviator игра позволит вам почувствовать себя настоящим пилотом. Вам предстоит совершить невероятные маневры, выполнять сложные задания и сражаться с противниками. Улучшайте свой самолет, чтобы быть готовым к любым ситуациям и становиться настоящим мастером.
Основные особенности Aviator краш игры:
1. Реалистичная графика и физика – благодаря передовой графике и реалистичной физике вы почувствуете себя настоящим пилотом.
2. Разнообразные режимы игры и миссии – в Aviator краш игре вы сможете выбрать различные режимы игры, такие как гонки, симулятор полетов и захватывающие воздушные бои. Кроме того, каждая миссия будет предлагать свои собственные вызовы и задачи.
3. Улучшение и модернизация самолетов – в игре доступны различные модели самолетов, которые можно покупать и улучшать. Вы сможете устанавливать новое оборудование, улучшать двигательность и мощность своего самолета, а также выбирать различные варианты окраски и декорации.
Aviator краш игра – это возможность испытать себя в роли авиатора и преодолеть все сложности и опасности воздушного пространства. Почувствуйте настоящую свободу и адреналин в Aviator краш игре онлайн!
Играйте в «Авиатор» в онлайн-казино Pin-Up
Aviator краш игра онлайн предлагает увлекательную и захватывающую игровую атмосферу, где вы становитесь настоящим авиатором и сражаетесь с самыми опасными искусственными интеллектами.
В этой игре вы должны показать свое мастерство и смекалку, чтобы преодолеть сложности многочисленных локаций и уровней. Вам предстоит собирать бонусы, уклоняться от препятствий и сражаться с врагами, используя свои навыки пилотирования и стрельбы.
Каждый уровень игры Aviator краш имеет свою уникальную атмосферу и задачи. Будьте готовы к неожиданностям, так как вас ждут захватывающие повороты сюжета и сложные испытания. Найдите все пути к победе и станьте настоящим героем авиатором!
Авиатор игра является прекрасным способом провести время и испытать настоящий адреналиновый разряд. Готовы ли вы стать лучшим авиатором? Не упустите свой шанс и начните играть в Aviator краш прямо сейчас!
Aviator – играй, сражайся, побеждай!
Aviator Pin Up (Авиатор Пин Ап ) – игра на деньги онлайн Казахстан
Aviator игра предлагает увлекательное и захватывающее разнообразие врагов и уровней, которые не оставят равнодушными даже самых требовательных геймеров.
Враги в Aviator краш игре онлайн представлены в самых разных формах и размерах. Здесь вы встретите группы из маленьких и быстрых врагов, а также огромных боссов с мощным вооружением. Разнообразие врагов позволяет игрокам использовать разные тактики и стратегии для победы.
Кроме того, Aviator игра предлагает разнообразие уровней сложности. Выберите легкий уровень, чтобы насладиться игровым процессом, или вызовите себе настоящий вызов, выбрав экспертный уровень. Независимо от выбранного уровня сложности, вы получите максимум удовольствия от игры и окунетесь в захватывающий мир авиаторов.
Играйте в Aviator и наслаждайтесь разнообразием врагов и уровней, которые позволят вам почувствовать себя настоящим авиатором.
buy acyclovir 400mg pill allopurinol 100mg pills allopurinol 300mg cost
generic norvasc buy amlodipine pills order norvasc online
purchase rosuvastatin pills order crestor 20mg zetia buy online
buy zestril 5mg without prescription generic prinivil lisinopril oral
buy generic motilium over the counter order sumycin generic sumycin for sale online
omeprazole price omeprazole 10mg cost omeprazole 20mg canada
buy flexeril pills for sale flexeril where to buy lioresal for sale online
metoprolol oral metoprolol 50mg us buy metoprolol 50mg pills
Hi there to every one, the contents present at this site are actually awesome for people knowledge, well, keep up the nice work fellows.
bcasino ie
What’s up, after reading this amazing article i am too happy to share my experience here with friends.
bcgame betrug
Hi there to every one, for the reason that I am genuinely keen of reading this blog’s post to be updated regularly. It consists of pleasant information.
booi casino promo code
Please let me know if you’re looking for a writer for your blog. You have some really great articles and I feel I would be a good asset. If you ever want to take some of the load off, I’d absolutely love to write some articles for your blog in exchange for a link back to mine. Please blast me an email if interested. Thanks!
fight club casino online
order toradol order toradol 10mg for sale brand colchicine 0.5mg
atenolol canada tenormin 50mg without prescription order tenormin 100mg without prescription
Ваш надежный партнер Прием Бронзы в Алматы Наша компания предлагает высококачественные услуги по приему, сортировке и переработке металлических отходов. Мы гарантируем прозрачные условия сотрудничества, конкурентоспособные цены и оперативное обслуживание.
depo-medrol over counter buy methylprednisolone buy generic methylprednisolone over the counter
inderal 10mg usa buy generic plavix order plavix 75mg
cheap essay online assignment company thesis website
methotrexate 2.5mg oral order warfarin 2mg online order warfarin pill
order reglan 20mg for sale cozaar pills cozaar 50mg pill
buy mobic cheap meloxicam pills generic celecoxib 200mg
order tamsulosin 0.4mg pills celecoxib buy online buy celecoxib online
esomeprazole 40mg capsules topamax 100mg ca how to buy topiramate
imitrex 50mg generic buy levaquin generic buy levaquin sale
ondansetron 8mg without prescription purchase zofran without prescription aldactone 100mg drug
buy avodart 0.5mg without prescription how to get avodart without a prescription buy ranitidine 150mg for sale
buy zocor paypal valacyclovir 1000mg price order valtrex 1000mg generic
cost finasteride 5mg order fluconazole 200mg generic buy fluconazole 100mg pill
buy acillin without prescription amoxicillin pill cheap amoxicillin online
order cipro 1000mg generic – keflex 500mg brand order amoxiclav
buy cipro – ethambutol online buy clavulanate without a prescription
metronidazole 200mg cheap – oxytetracycline 250mg without prescription azithromycin 500mg oral
order generic ciprofloxacin 500 mg – order amoxicillin 500mg
order erythromycin generic
cost valacyclovir 1000mg – nateglinide 120mg cost acyclovir 400mg generic
ivermectin australia – ciprofloxacin online order purchase sumycin sale
buy metronidazole 400mg pill – order azithromycin 250mg azithromycin price
Thank you for the sensible critique. Me & my neighbor were just preparing to do a little research on this. We got a grab a book from our local library but I think I learned more from this post. I’m very glad to see such great info being shared freely out there.
Good write-up, I?¦m normal visitor of one?¦s site, maintain up the excellent operate, and It’s going to be a regular visitor for a lengthy time.
order retrovir 300 mg online – allopurinol sale allopurinol buy online
order glycomet 500mg – order metformin 1000mg without prescription buy lincocin 500mg sale
Today, learn how to easily enhance your digital footprint with our tested strategies. Whether you’re looking to increase your audience or maximize your conversion rates, our guide offers simple steps and tips that will change the way you think about digital marketing. Don’t miss out and take your brand to the next level!
Find out more to discover the strategies behind our success https://bit.ly/email-marketing-sales
Authorities say it will protect the city and ensure stability, while critics are alarmed it will silence all dissent with its closed-door trials and life sentences for broadly양산출장안마-defined offences – from insurrection to treason.
I also conceive therefore, perfectly written post! .
Unleash your creative potential and enter a state of flow with this revolutionary brainwave entrainment program.
Explore more now https://bit.ly/brainwave-act-now
order quetiapine 50mg for sale – geodon 40mg over the counter where can i buy eskalith
order clozaril online – brand amaryl 4mg famotidine 40mg price
Be part of the traffic generation revolution. Discover how our simple, automated system can change the way you do business online.
See Offers -> https://cutt.ly/1w9zNLPM
generic atarax 25mg – buy sarafem pill amitriptyline 25mg brand
anafranil 25mg pill – asendin 50mg without prescription doxepin 25mg over the counter
This really answered my problem, thank you!
cheap amoxicillin for sale – ceftin 500mg without prescription buy cipro pill
buy augmentin 375mg for sale – order augmentin 1000mg cipro over the counter
cleocin 300mg over the counter – terramycin 250 mg cheap buy chloramphenicol without a prescription
I’ve recently started a site, the information you offer on this web site has helped me greatly. Thanks for all of your time & work.
zithromax generic – purchase flagyl for sale purchase ciprofloxacin pills
ventolin inhalator cost – fluticasone over the counter buy theo-24 Cr generic
stromectol 12 mg – ivermectin us buy cefaclor without a prescription
where to buy desloratadine without a prescription – buy beclomethasone nasal sprays buy albuterol 2mg online cheap
Great web site. A lot of helpful information here. I am sending it to several friends ans also sharing in delicious. And certainly, thank you in your sweat!
Woah! I’m really enjoying the template/theme of this website. It’s simple, yet effective. A lot of times it’s very hard to get that “perfect balance” between superb usability and visual appeal. I must say you have done a very good job with this. In addition, the blog loads very quick for me on Opera. Superb Blog!
You have observed very interesting points! ps nice internet site.
I reckon something truly special in this website.
methylprednisolone 16 mg tablets – buy montelukast pill astelin without prescription
I really appreciate this post. I¦ve been looking all over for this! Thank goodness I found it on Bing. You have made my day! Thx again
micronase 2.5mg usa – purchase forxiga sale purchase forxiga
order repaglinide 1mg sale – buy prandin 2mg generic jardiance 25mg cheap
What Is Sugar Defender? Sugar Defender Drops is a powerful friend for people who want to control their blood sugar levels
buy generic glucophage 1000mg – sitagliptin cost how to get acarbose without a prescription
order lamisil 250mg generic – oral grifulvin v purchase grifulvin v pill
I do love the manner in which you have framed this particular problem and it really does provide us some fodder for thought. Nonetheless, because of everything that I have observed, I simply trust as other opinions pack on that folks remain on point and not get started on a tirade associated with the news du jour. All the same, thank you for this outstanding point and though I do not necessarily concur with it in totality, I regard your viewpoint.
I think you have noted some very interesting points, regards for the post.
semaglutide 14mg uk – order glucovance generic buy desmopressin
nizoral cheap – sporanox 100 mg us itraconazole pill
order lanoxin pills – purchase avapro purchase lasix pill
famvir buy online – famciclovir 500mg uk valcivir 500mg pill
microzide generic – bisoprolol 5mg over the counter buy zebeta paypal
buy generic nitroglycerin online – buy generic combipres valsartan canada
lopressor 50mg ca – micardis order online order nifedipine without prescription
rosuvastatin pills healthy – pravastatin buy hill caduet buy adult
viagra professional online fumble – buy cialis professional musical levitra oral jelly wreck
FitSpresso is a weight loss supplement developed using clinically proven ingredients extracted from natural sources.
cenforce fifteen – zenegra online wood brand viagra pills way
Hello my loved one! I want to say that this post is awesome, nice written and come with approximately all important infos. I would like to peer extra posts like this .
dapoxetine moan – sildigra relation cialis with dapoxetine david
brand cialis attempt – zhewitra follow penisole tone
cialis soft tabs beside – cialis soft tabs lamp viagra oral jelly love
I truly appreciate this post. I’ve been looking all over for this! Thank goodness I found it on Bing. You’ve made my day! Thanks again!
Thank you for every other great post. The place else may just anyone get that kind of info in such an ideal means of writing? I’ve a presentation next week, and I’m on the look for such info.
brand cialis something – alprostadil company penisole temporary
As I web-site possessor I believe the content material here is rattling wonderful , appreciate it for your hard work. You should keep it up forever! Best of luck.
cialis soft tabs demand – tadarise pills achieve viagra oral jelly online cloud
wonderful post, very informative. I wonder why the other experts of this sector don’t notice this. You should continue your writing. I’m sure, you have a huge readers’ base already!
Hey there this is kinda of off topic but I was wanting to know if blogs use WYSIWYG editors or if you have to manually code with HTML. I’m starting a blog soon but have no coding experience so I wanted to get guidance from someone with experience. Any help would be greatly appreciated!
cenforce online take – zenegra linger brand viagra pills march
Tonic Greens is a natural health supplement created to help improve immune health.
I¦ll right away grab your rss feed as I can not find your e-mail subscription hyperlink or e-newsletter service. Do you’ve any? Please let me recognise so that I may just subscribe. Thanks.
ダッチワイフ av シリコーンのダッチワイフを利用する前に知っておくべきルール
acne medication haste – acne medication possibility acne medication dread
I really enjoy examining on this website , it has got excellent articles. “Heavier-than-air flying machines are impossible.” by Lord Kelvin.
asthma treatment writhe – inhalers for asthma complicate asthma treatment divide
uti treatment abandon – uti treatment bedroom uti treatment principal
pills for treat prostatitis pace – prostatitis treatment model prostatitis pills adult
valacyclovir pills which – valacyclovir pat valacyclovir bright
I want examining and I believe this website got some truly utilitarian stuff on it! .
I do agree with all the ideas you have presented in your post. They’re very convincing and will definitely work. Still, the posts are very short for starters. Could you please extend them a bit from next time? Thanks for the post.
Good – I should certainly pronounce, impressed with your site. I had no trouble navigating through all tabs and related information ended up being truly simple to do to access. I recently found what I hoped for before you know it at all. Quite unusual. Is likely to appreciate it for those who add forums or anything, web site theme . a tones way for your customer to communicate. Excellent task..
I was very pleased to find this web-site.I wanted to thanks for your time for this wonderful read!! I definitely enjoying every little bit of it and I have you bookmarked to check out new stuff you blog post.
claritin pills bulge – claritin pills whip loratadine medication empty
claritin pills desert – claritin pills soak loratadine difficulty
FitSpresso is a natural weight loss supplement crafted from organic ingredients, offering a safe and side effect-free solution for reducing body weight.
Respect to author, some good entropy.
dapoxetine sympathy – priligy loud priligy twinkle
promethazine wither – promethazine fragment promethazine death
Hey, you used to write great, but the last few posts have been kinda boringK I miss your super writings. Past several posts are just a little out of track! come on!
ascorbic acid vanish – ascorbic acid sun ascorbic acid floor
Yesterday, while I was at work, my sister stole my iPad and tested to see if it can survive a twenty five foot drop, just so she can be a youtube sensation. My apple ipad is now destroyed and she has 83 views. I know this is entirely off topic but I had to share it with someone!
florinef pills dimension – protonix cigarette lansoprazole pills wet
clarithromycin pills score – cytotec embrace cytotec pills aspect
Level up your gaming experience with our latest online RPG! Hawkplay
I will right away grab your rss feed as I can’t find your email subscription link or newsletter service. Do you have any? Please let me know in order that I could subscribe. Thanks.
pill dulcolax – loperamide canada liv52 usa
buy aciphex without a prescription – buy domperidone no prescription motilium 10mg ca
generic bactrim 480mg – order cotrimoxazole 960mg pills tobrex buy online
eukroma medication – dydrogesterone pills duphaston 10 mg us
buy dapagliflozin pills – order precose for sale acarbose generic
fulvicin buy online – order fulvicin 250mg without prescription gemfibrozil 300 mg sale
Greetings! Very helpful advice on this article! It is the little changes that make the biggest changes. Thanks a lot for sharing!
I have been exploring for a little for any high-quality articles or weblog posts in this kind of area . Exploring in Yahoo I finally stumbled upon this web site. Studying this information So i?¦m glad to convey that I have an incredibly excellent uncanny feeling I came upon exactly what I needed. I such a lot without a doubt will make certain to don?¦t disregard this site and give it a look on a constant basis.
cheap vasotec – order vasotec 5mg generic buy xalatan online
buy dramamine online cheap – dimenhydrinate uk risedronate 35 mg canada
order feldene generic – piroxicam generic order rivastigmine generic
order etodolac 600 mg sale – order generic monograph 600mg order pletal 100mg generic
Oh my goodness! a tremendous article dude. Thanks Nonetheless I’m experiencing concern with ur rss . Don’t know why Unable to subscribe to it. Is there anyone getting identical rss drawback? Anybody who knows kindly respond. Thnkx
I was just searching for this information for a while. After 6 hours of continuous Googleing, finally I got it in your site. I wonder what’s the lack of Google strategy that don’t rank this kind of informative web sites in top of the list. Generally the top web sites are full of garbage.
hydrea us – methocarbamol online order buy methocarbamol cheap
order piracetam 800 mg for sale – sustiva usa oral sinemet
cheap disopyramide phosphate without prescription – disopyramide phosphate uk buy chlorpromazine cheap
FitSpresso: What Is It?FitSpresso is a natural weight loss aid designed for individuals dealing with stubborn weight gain. It is made using only science-backed natural ingredients.
depakote online order – order topamax 100mg generic generic topiramate
cheap cytoxan sale – cyclophosphamide over the counter order vastarel sale
You made some decent points there. I looked on the web for the problem and found most people will go together with with your website.
I always was interested in this topic and still am, thankyou for putting up.
aldactone online buy – spironolactone order purchase naltrexone sale
Somebody essentially help to make seriously posts I would state. This is the very first time I frequented your web page and thus far? I amazed with the research you made to make this particular publish incredible. Magnificent job!
You actually make it seem so easy together with
your presentation but I find this matter to be actually one thing which I believe I might by no means understand.
It kind of feels too complicated and extremely wide for me.
I’m taking a look ahead for your next publish, I’ll attempt
to get the dangle of it! Najlepsze escape roomy
It¦s actually a great and helpful piece of info. I¦m happy that you just shared this useful info with us. Please keep us informed like this. Thank you for sharing.
I don’t usually comment but I gotta state appreciate it for the post on this special one : D.
I like this web site very much, Its a real nice spot to
read and receive info.!
buy ondansetron 8mg pills – zofran 4mg generic buy cheap requip
cyclobenzaprine where to buy – order primaquine generic order enalapril sale
buy durex gel for sale – durex condoms purchase online latanoprost where to buy
order ascorbic acid 500mg online cheap – oral lopinavir ritonavir where to buy prochlorperazine without a prescription
What Is Java Burn? Java Burn is a natural health supplement that is formulated using clinically backed ingredients that promote healthy weight loss.
Very well written information. It will be helpful to everyone who usess it, including myself. Keep doing what you are doing – can’r wait to read more posts.
ProNerve 6 nerve relief formula stands out due to its advanced formula combining natural ingredients that have been specifically put together for the exceptional health advantages it offers.
Thanks , I’ve recently been searching for info approximately this topic for ages and yours is the best I’ve discovered so far. But, what about the bottom line? Are you positive concerning the supply?
Awsome info and straight to the point. I don’t know if this is actually the best place to ask but do you guys have any ideea where to hire some professional writers? Thanks in advance 🙂
leflunomide 20mg tablet – actonel usa buy generic cartidin for sale
order rogaine without prescription – rogaine cost propecia for sale
atenolol for sale – plavix 150mg pills oral coreg 6.25mg
buy calan cheap – order generic diovan 80mg where to buy tenoretic without a prescription
atorvastatin order online – order nebivolol sale cost bystolic 5mg
buy lasuna tablets – where can i buy diarex buy himcolin tablets
order gasex generic – generic gasex buy diabecon tablets
Hi, Neat post. There is an issue with your site in internet explorer, would test thisK IE still is the market chief and a good component to other people will omit your fantastic writing due to this problem.
buy generic speman online – buy generic finasteride purchase finasteride sale
I liked as much as you will obtain performed proper here. The cartoon is attractive, your authored material stylish. however, you command get got an impatience over that you wish be turning in the following. ill for sure come more until now again since exactly the similar nearly very often inside of case you protect this increase.
I would like to point out my gratitude for your generosity for individuals who absolutely need assistance with this one theme. Your real commitment to passing the message along had become incredibly good and have frequently allowed ladies just like me to get to their goals. Your helpful guideline indicates a whole lot to me and far more to my colleagues. Thank you; from everyone of us.
buy noroxin for sale – buy eulexin cheap purchase confido generic